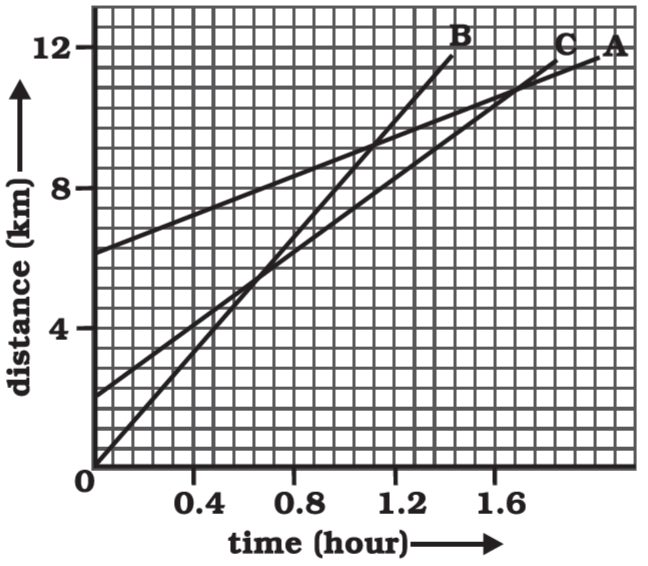
Fig 8.11 Shows the distance-time graph of three objects A, B and C. Study the graph and answer the following questions: (a) Which of the three is travelling the fastest? (b) Are all three ever at the same point on the road? (c) How far has C travelled when B passes A? (d)How far has B travelled by the time it passes C?

Ans: (a) Speed = Slope of distance-time graph.
Since Object B has more slope than A and C, that’s why speed of object B is greater than A and C.
(b) No. All three objects A, B and C never meet at a single point.
But, at (i) 1.6 second A and C are at the same point on the road.
(ii) 1.12 second A and B are at the same point on the road.
(III) 0.64 second B and C are at the same point on the road.
(c) There are 7 unit areas of the graph between 0 and 4 on the Y axis so, 1 graph unit equals 4/7 km. Since the initial point of an object C is 4 graph units away from the origin, Its initial distance from the origin is 4 × (4/7)km = 16/7 km
When B passes A, (at 1.12 second) the distance between the origin and C is 8km
Therefore, total distance travelled by C in this time = 8 – (16/7) km = 5.71 km
(d) B possesses C at time 0.64second. Distance covered by B at that time is equal to 5.143km (9 boxes/area units on Y-axis)
Acceleration:
Acceleration is a fundamental concept in physics that measures the rate of change of velocity with respect to time.
It describes how velocity of an object changes over time.
Mathematically, acceleration (a) is defined as,
Acceleration (a) = Change in velocity / Time taken
Acceleration is a vector quantity, which means it has both magnitude and direction. It is typically measured in units of meters per second squared (m/s²) in the International System of Units (SI).
Acceleration can occur in various forms. Positive acceleration, also known as speeding up, occurs when an object’s velocity increases over time. Negative acceleration, or deceleration, occurs when an object’s velocity decreases over time. If the velocity of an object remains constant, the acceleration is zero.
Table of Contents
MY YouTube Channel Link : 👉🖱 https://www.youtube.com/channel/UCGpC7nWE0-bBv9I53MM8qjQ
Fig 8.11 Shows the distance-time graph of three objects A, Fig 8.11 Shows the distance-time graph of three objects A, Fig 8.11 Shows the distance-time graph of three objects A, Fig 8.11 Shows the distance-time graph of three objects A,